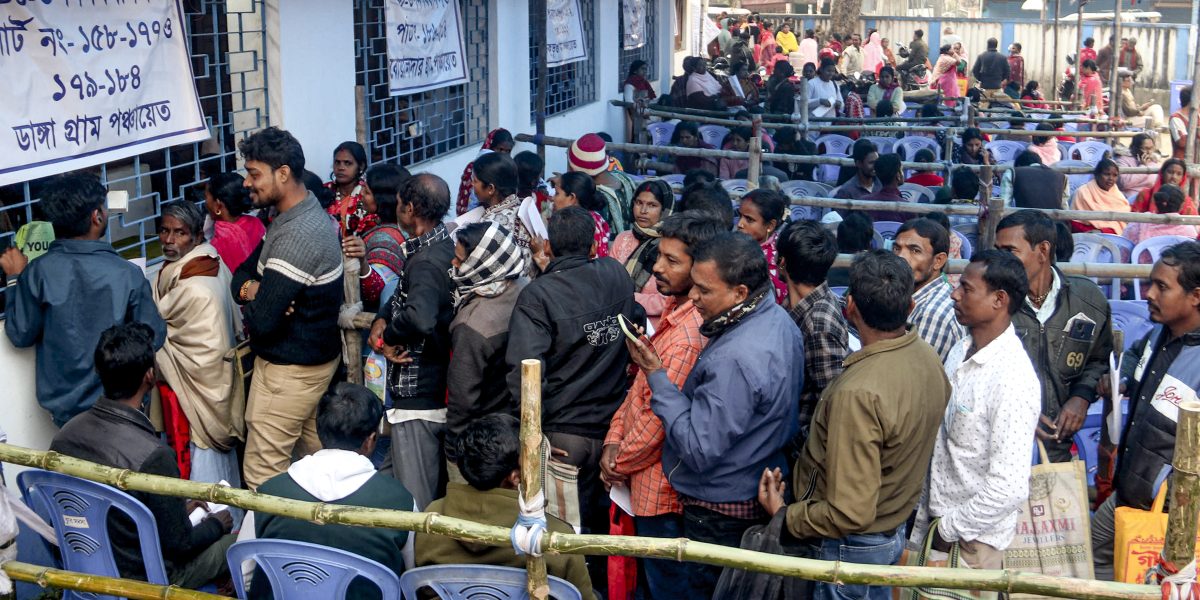
A sharp surge in hearing notices served under the Special Intensive Revision (SIR) of electoral rolls in West Bengal has triggered allegations of selective scrutiny. Field data reveals a strong correlation between minority-dominated districts and the volume of voters called for verification under the process. Data compiled from across the state indicates that the SIR’s “discrepancy” detection system is disproportionately flagging voters in Muslim-majority areas. There is growing concern that software-driven processes may be generating false positives in Bengali names, risking the silent disenfranchisement of legitimate voters before the upcoming Assembly election.
The concern has sharpened after initial SIR data failed to consolidate support for the Bharatiya Janata Party’s (BJP) earlier polarisation attempts around Rohingya and Bangladeshi “infiltration”. Instead, the release of the Draft Roll and Absentee, Shifted, Suspected Dead (ASSD) list sparked resentment in Matua and other Hindu Scheduled Caste localities. These communities were hit heavily by deletions and no-mapping, due to which the narrative backfired. In recent weeks, however, the administrative focus appears to have shifted, through the SIR hearing process, towards minority-heavy Polling Stations (PS).
In The Wire’s earlier constituency-level reading of the SIR draft rolls, “No Mapping” emerged as a key pressure point. Voters who could not be linked to the 2002 roll, the legacy anchor in the SIR 2025 framework, were effectively pushed into a higher-risk verification pathway. But the analysis also produced an inconvenient statistical outcome for BJP’s “infiltration” propaganda. Muslim-majority constituencies appeared among the most consistently mapped and, therefore, among the most documented. In Murshidabad, for instance, Domkal (77.67% minority population) showed just 0.42% No Mapping, while Raninagar (75.40% minority) recorded 0.91%, Hariharpara (74.96% minority) 0.60%, and Lalgola (77.29% minority) 1.1%.
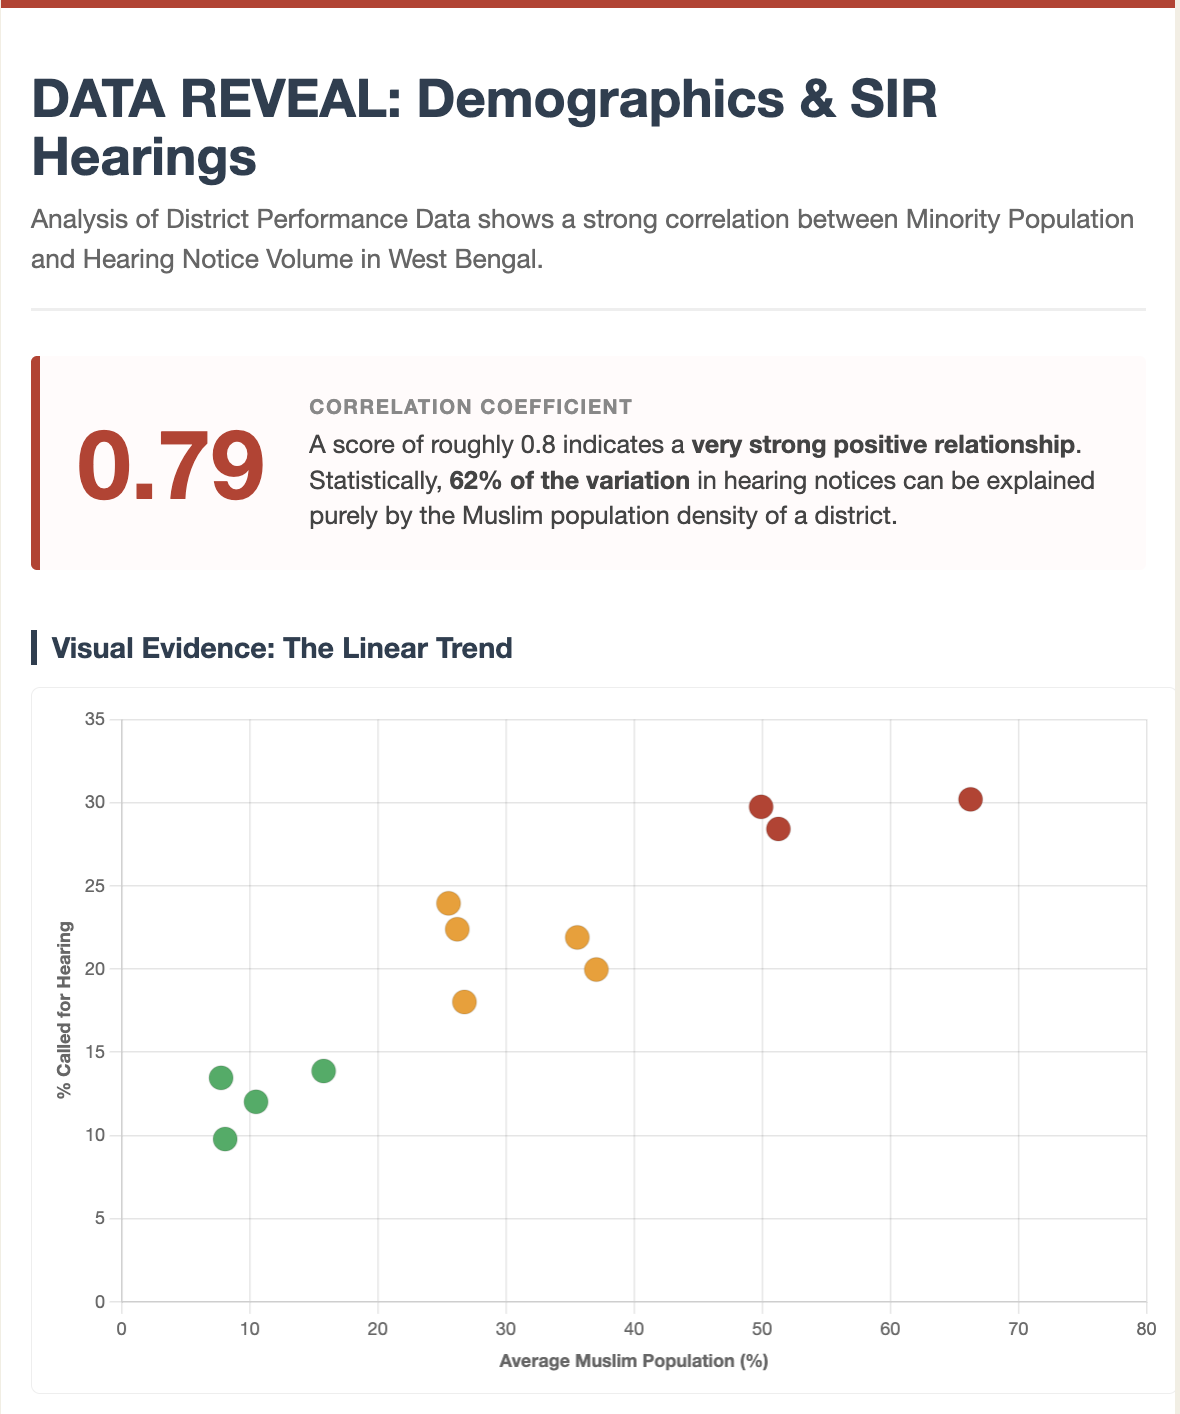
Muslim-majority districts see the most SIR hearings
Yet the district-wise hearing numbers reviewed by The Wire tell a sharply different story. Across districts, the share of voters called for hearings climbs steeply with the Muslim population share. Statistical analysis of the dataset shows a strong positive correlation between a district’s Muslim population percentage and the percentage of electors called for hearing per constituency, with a correlation coefficient of 0.79. In practical terms, this implies that approximately 62% of the variation in hearing-call rates across districts can be explained by Muslim population density alone.
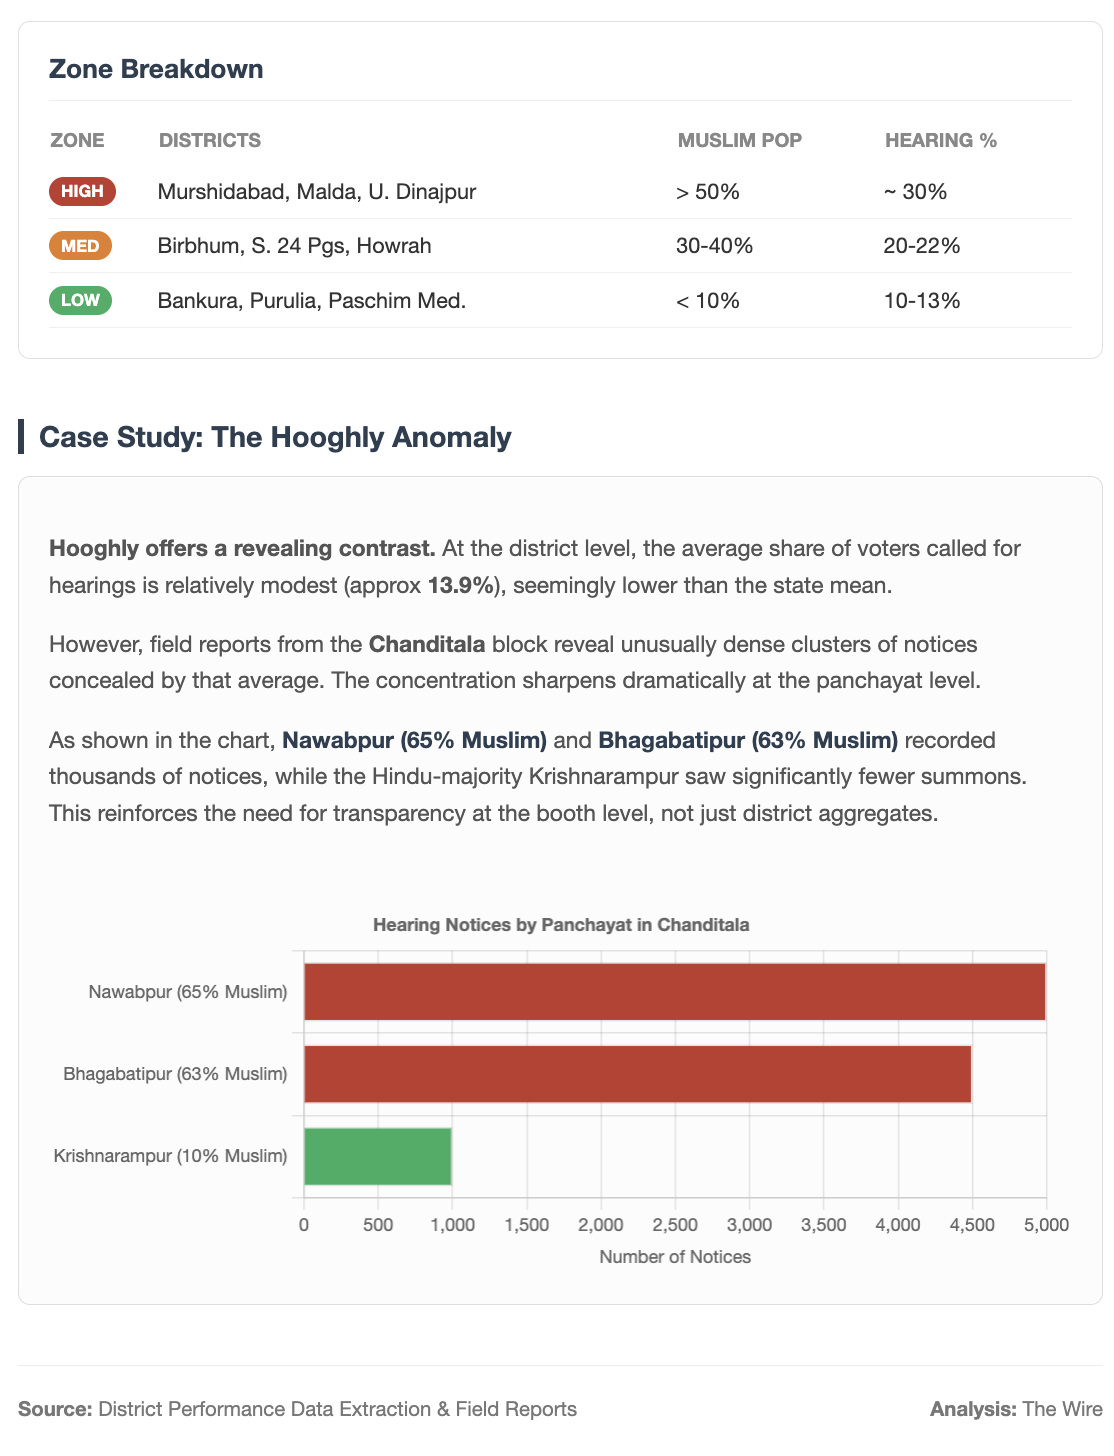
The implication is stark: even where Muslims appear highly “mapped” (low No Mapping), Muslim-heavy districts still show the highest hearing intensity, suggesting the system driving voters into hearings is not primarily No Mapping, but other triggers such as “logical discrepancies”, duplicates and name-related mismatches, especially those amplified by script conversion and rigid matching rules.
This story was originally published in thewire.in. Read the full story here.